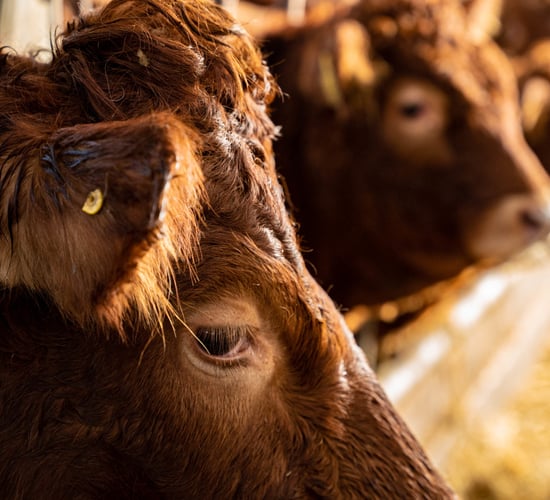
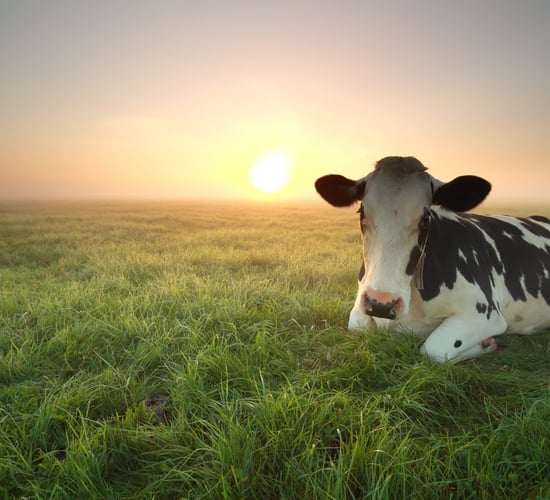
CSO: Food prices up almost 4% in 12 months


Food prices in Ireland are estimated to have risen by 0.2% in the last month and increased by 3.9% in the last 12 months.
The EU Harmonised Index of Consumer Prices (HICP) for Ireland is estimated to have increased by 2.6% in the 12 months to January 2026, and decreased by 1% since December 2025, according to the latest publication by the Central Statistics Office (CSO).
This compares with HICP inflation of 2.7% in Ireland in the 12 months to December 2025 and an annual rise of 1.9% in the HICP for the Eurozone in the same period.
Food prices
Looking at the components of the flash HICP for Ireland in January 2026, aside from a rise in food prices, energy prices are estimated to have fallen by 0.8% in the month and were up by 0.3% over the 12 months to January 2026.
Excluding energy and unprocessed food, the HICP is estimated to have gone up by 2.7% since January 2025.
Eurostat will publish flash estimates of inflation from the EU HICP for the Eurozone for January 2026 next week.
Commenting on the data published today, statistician in the Prices Division, CSO Ireland Anthony Dawson said: “The latest flash estimate of the Harmonised Index of Consumer Prices (HICP), compiled by the CSO, indicates that prices for consumer goods and services in Ireland are estimated to have increased by 2.6% in the past year.
"Looking at the components of the flash HICP in Ireland for January 2026, energy prices are estimated to have dropped by 0.8% in the month and gone up by 0.3% since January 2025.
"The HICP excluding energy and unprocessed food prices, is estimated to have risen by 2.7% since January 2025.
"Food prices are estimated to have grown by 0.2% in the last month and increased by 3.9% in the last 12 months."
Meanwhile, service prices have fallen by 1.1% in the month and risen by 3.3% in the 12 months to January 2026.
| HICP Special Aggregate | Monthly % change | Annual % change |
|---|---|---|
| HICP excluding Energy and Unprocessed Food | -1.0 | 2.7 |
| Energy | -0.8 | 0.3 |
| Services | -1.1 | 3.3 |
| Non-Energy Industrial Goods | -1.9 | 1.0 |
| Food excluding Alcohol and Tobacco | 0.2 | 3.9 |
| Unprocessed Food | -0.1 | 5.8 |
| Processed Food | 1.0 | 2.6 |
| Food including Alcohol and Tobacco | 0.8 | 3.4 |
| HICP excluding Energy | -0.9 | 2.9 |
| HICP excluding Energy, Food, Alcohol and Tobacco | -1.3 | 2.7 |
| All Items HICP | -1.0 | 2.6 |